 Welcome to the Computer Vision and Multimedia Lab website.
Italian version
PAVIA. The Battle, the future. Nothing was the same
Italian version
PAVIA. The Battle, the future. Nothing was the same
Italian version
PAVIA. The Battle, the future. Nothing was the same
Italian version
PAVIA. The Battle, the future. Nothing was the same
Italian version
PAVIA. The Battle, the future. Nothing was the same
Italian version
PAVIA. The Battle, the future. Nothing was the same
Italian version
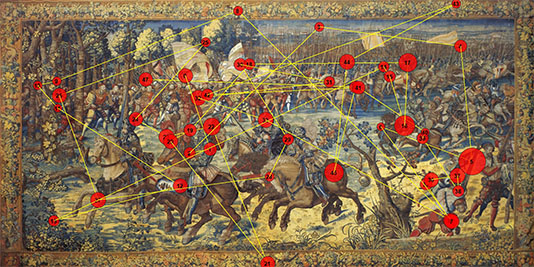 A gazeplot is a graphical representation that uses circles and segments to indicate what has been watched
during the observation of an image (or while performing any task with the computer). In particular, circles' areas
are proportional to the duration of fixations, i.e. the moments when the gaze is focused on specific
spots. Segments connecting circles indicate saccades, i.e the very fast gaze shifts from one point
to another. Numbers on circles specify the order of fixations.
A gazeplot is a graphical representation that uses circles and segments to indicate what has been watched
during the observation of an image (or while performing any task with the computer). In particular, circles' areas
are proportional to the duration of fixations, i.e. the moments when the gaze is focused on specific
spots. Segments connecting circles indicate saccades, i.e the very fast gaze shifts from one point
to another. Numbers on circles specify the order of fixations.