
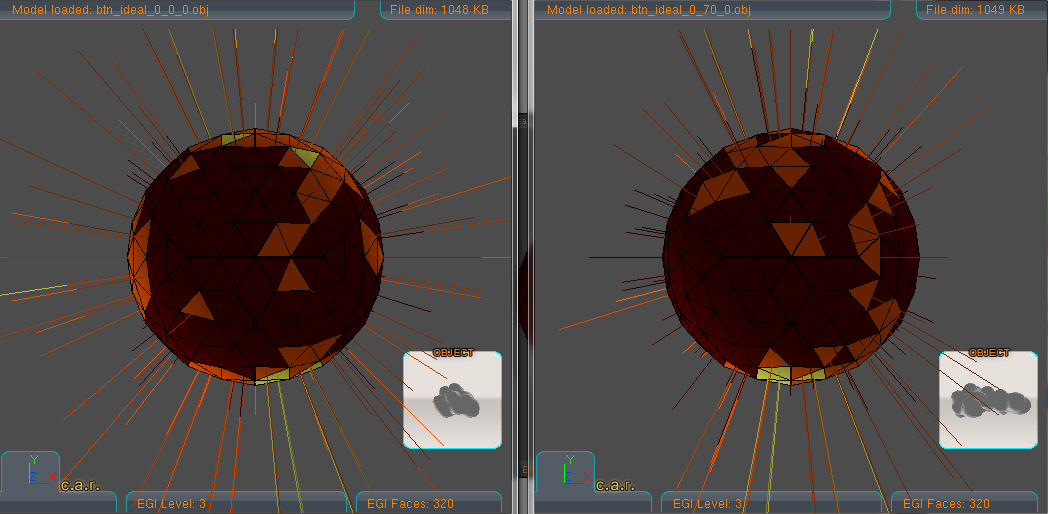
The package is based on the EGI (Extended Gaussian Image) representation and onmany of its variation for proteins surface docking,
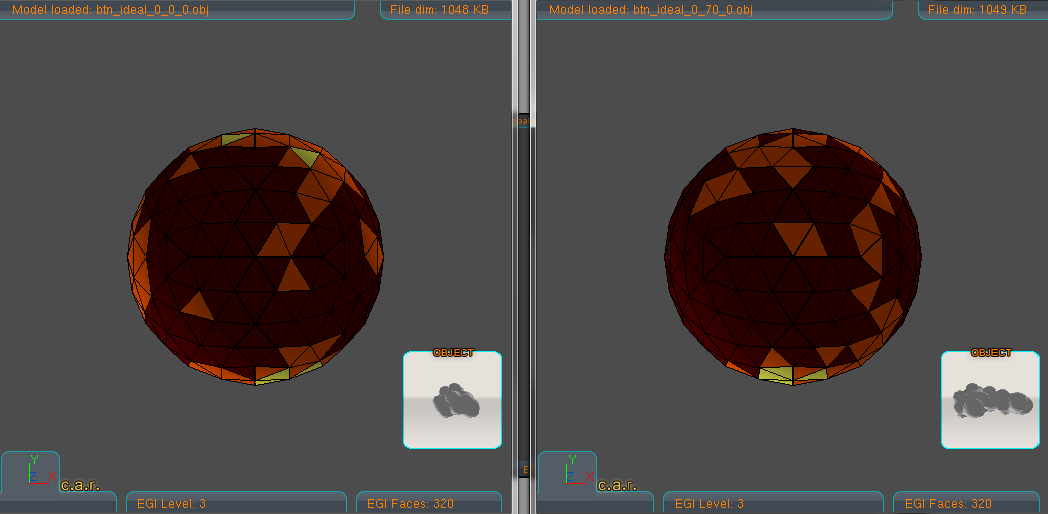
in particular the case protein-ligand. The EGI is the histogram of surface orientation represented on the unitary sphere.
In particular, the Enriched Complex EGI that is an extended version in which the orientation is combined with the distance
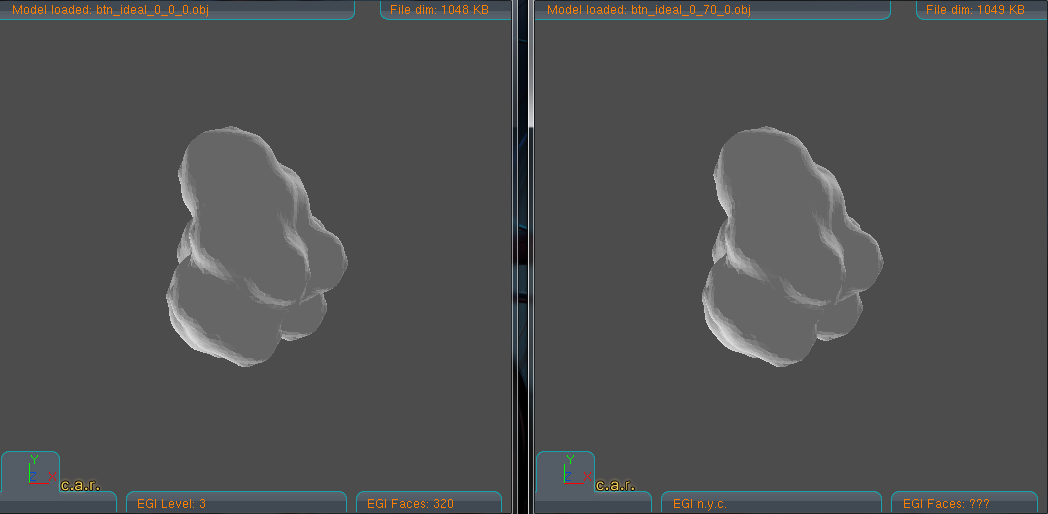
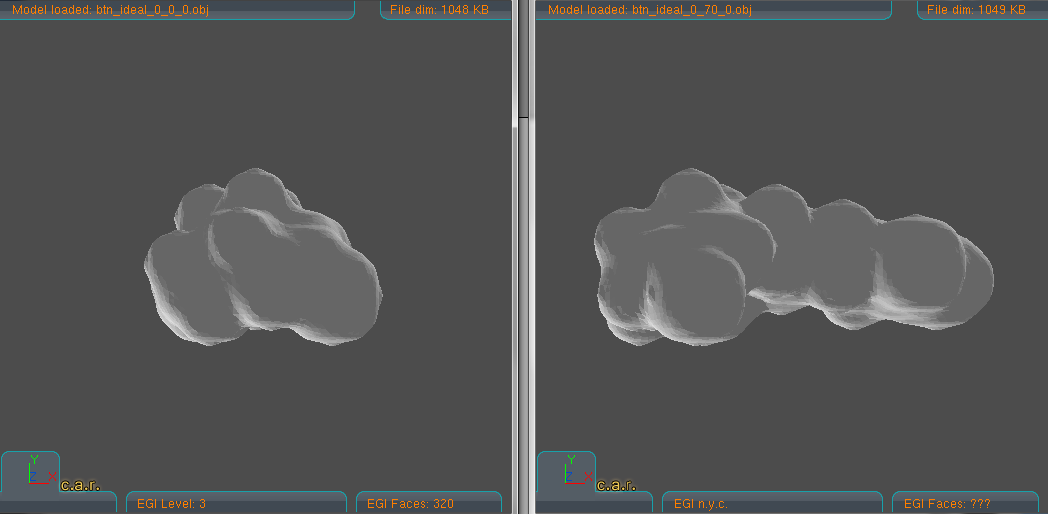
from the three planes XY,XZ and YZ has been developed. After loading the structural blocks, aligning them and the EGIs construction,
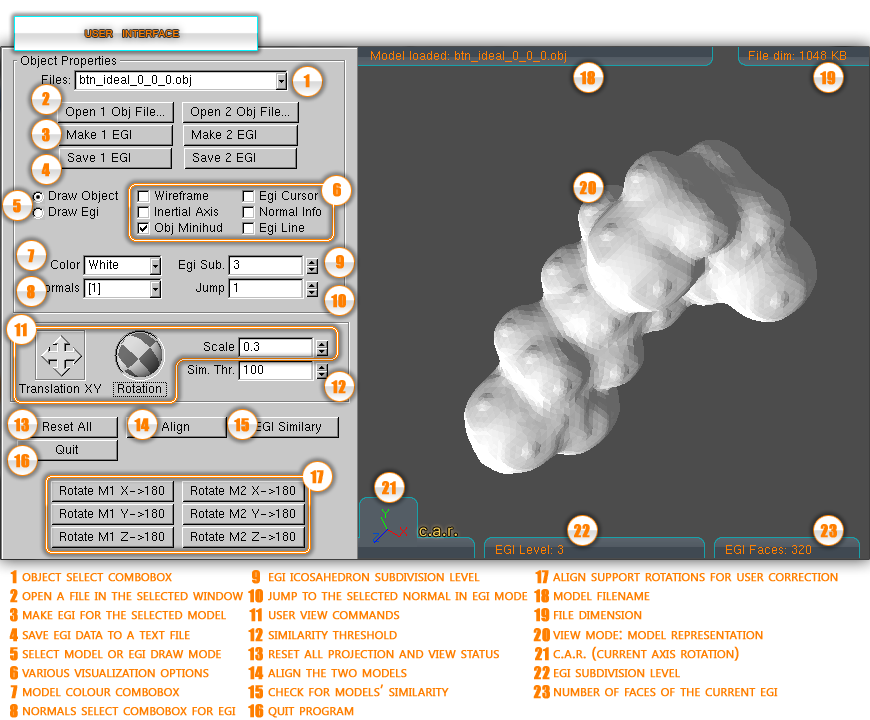
the results are displayed in two screen areas, one per block. To facilitate user interaction a rich, customizable GUI supporting
many different features is provided: e.g. animated normal cursor selector, distance errors, accuracy and coverage data, etc...
By an external configuration, the E.G.I. Protein Visualizer can be applied in three different modalities:
- With the GUI extension (default).
- In a semi-auto mode (from console).
- In auto-mode, with results supplied on a text file.
To compare molecules and for similarity evaluation five distance error types are supported:
- The Euclidean distance.
- The Bryan Curtis distance.
- The EC-EGI distance.
- The Bryan Curtis on EC-EGI.
- The Hausdorff distance.
The E.G.I. Protein Visualizer allows to define different resolution levels . The matching results can be saved into different format files, to fit other packages importing methods (e.g. Microsoft Excel). Improvement are made on a day by day basis to achieve further results.
Telephone: +39 0382 985486
E-mail: alessandro.gaggia@unipv.it